Root Cause Analysis of PCBA Failures
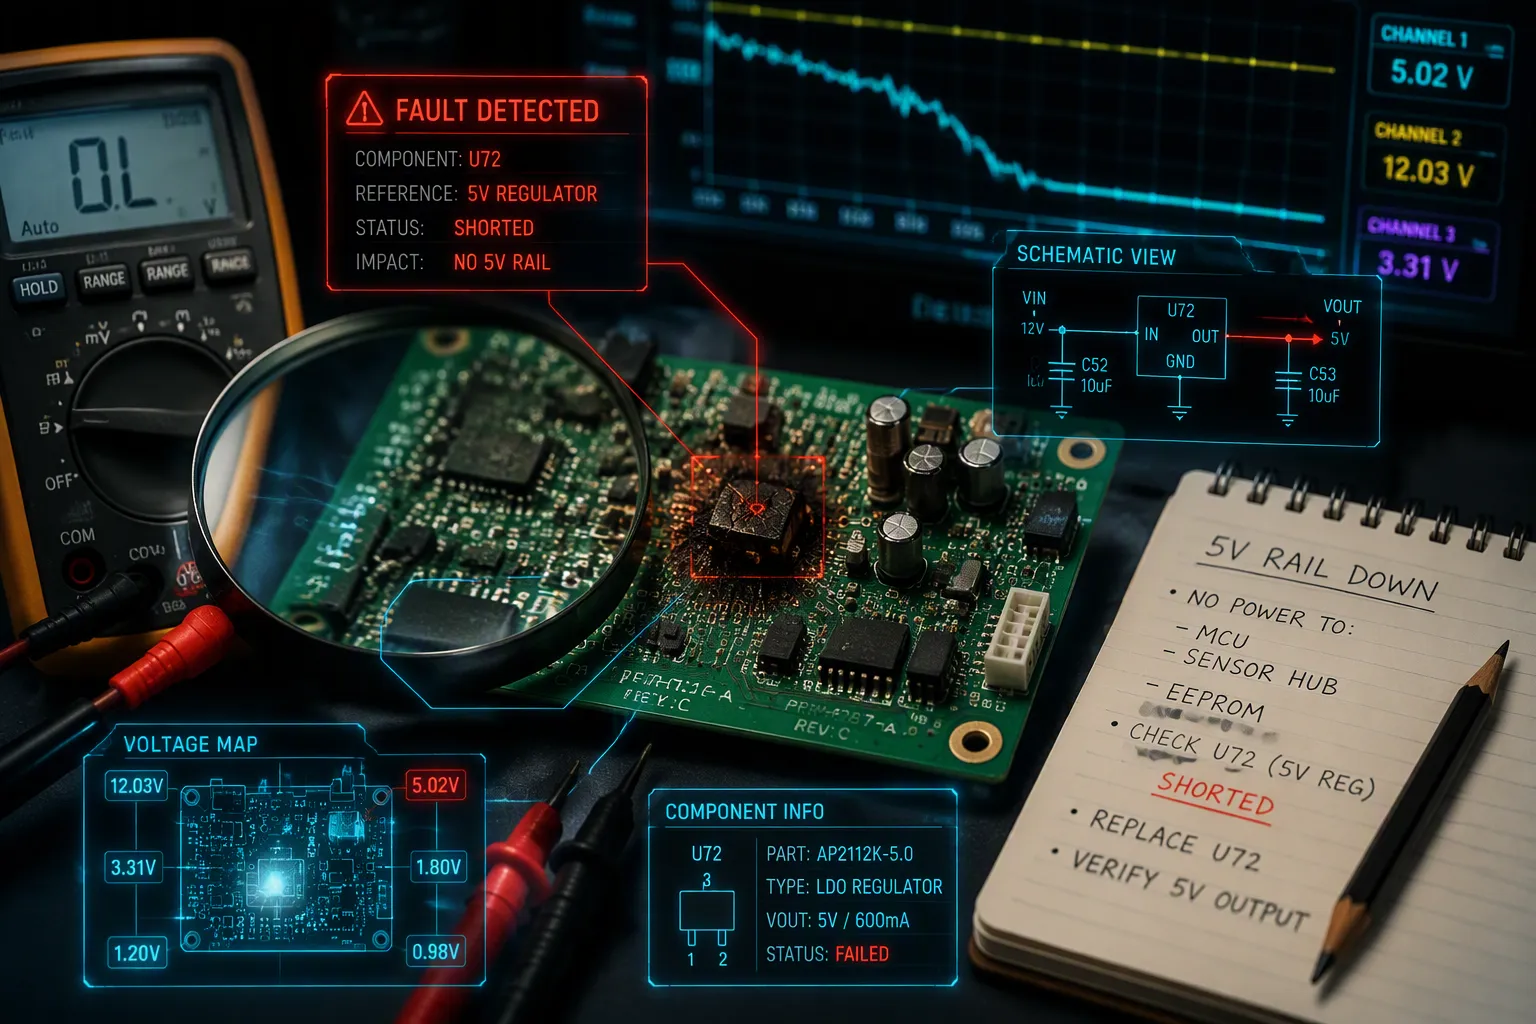
Imagine a 1% scrap rate on 10,000 boards at $10 each. That’s $1,000 in direct losses before you count rework time. A misplaced part in an automotive ABS PCBA can cause brake failure, leading to costly recalls and lawsuits. Replacing that board in a sold vehicle costs 10 to 20 times more than fixing it during production. As one field return shows, the real cost is downtime, reputation, and customer trust. Fixing a solder joint reactively treats symptoms, not the root cause. You need a careful PCBA failure analysis to find the fundamental reason for failure. This post offers a practical step-by-step guide—from collecting evidence to permanent fixes—using proven methods.
Key Takeaways
Begin with non-destructive tests such as X-ray and AOI to keep the evidence intact.
Use a step-by-step process to find the real root cause, not just the signs.
Use electrical tests and advanced imaging together to get the full failure picture.
Classify failures as manufacturing, design, or environmental to guide fixes.
Put lasting fixes in place and watch them to stop the problem from coming back.
Defining the Failure and Initial Evidence
Before you power up a single board, you must document the failure mode and operating conditions. Was the failure intermittent or catastrophic? What temperature, voltage, and humidity levels existed at the time of failure? This information guides every subsequent step of your pcba failure analysis. Without it, you risk chasing symptoms rather than causes.
Crafting a Detailed Failure Description
Start by categorizing the failure. Common categories include soldering defects, component damage, short circuits, open circuits, incorrect components, PCB warping, poor electrical performance, insufficient cleaning, mechanical damage, and environmental stress failures. Each category has distinct symptoms and potential causes. For example, cold solder joints or solder bridges indicate reflow temperature issues or pad/lead mismatch. Burned components suggest ESD, overvoltage, or mechanical stress.
Document the operating context thoroughly. Record the environmental conditions, electrical loads, and any unusual events preceding the failure. Use a structured approach like Failure Mode and Effects Analysis (FMEA) to score severity, occurrence, and detection on a 1-10 scale. Calculate the Risk Priority Number (RPN) by multiplying these three scores. This systematic method helps you prioritize which failures demand immediate attention. High-reliability electronics must pass multiple qualification rounds to withstand their intended environment. Designing to IPC standards or stricter industry requirements ensures a manufacturable board that performs reliably.
Non-Destructive Inspection Techniques
Non-destructive techniques preserve your board for further analysis. These methods reveal physical defects without altering the sample. The table below summarizes the primary options:
NDT Technique | Application in PCBA Failure Analysis |
|---|---|
Visual & Stereomicroscopic Examination | Documents fracture initiation sites, surface anomalies, and manufacturing marks |
Liquid Penetrant Inspection | Reveals secondary cracks and stress corrosion cracking networks |
Ultrasonic Examination | Scans for sub-critical cracks and internal defects |
Radiographic Inspection (X-ray) | Reveals internal porosity, inclusions, and corrosion |
Eddy Current Testing | Detects surface cracks and conductivity variations |
Automated optical inspection (AOI) excels at surface-level defects, achieving detection rates up to 95% for missing components, solder bridges, and misalignment. However, AOI cannot see hidden joints beneath BGAs or bottom-terminated packages. Automated X-ray inspection (AXI) reaches 99% accuracy for internal defects like solder voids, which can exceed 25% in poorly controlled processes. X-ray inspection becomes mandatory in automotive (IATF 16949) and aerospace (IPC Class 3) environments. In-circuit testing verifies component values, continuity, and circuit function using custom fixtures. These pcb inspection methods complement each other; a hybrid approach combining AOI on every board with selective AXI for complex components balances cost, speed, and quality. This combination of pcb testing techniques forms your first line of defense in pcb fault finding.
High-reliability electronics must go through multiple rounds of testing and qualification to ensure they can withstand their intended operating environment.
These non-destructive pcb inspection methods provide critical evidence while preserving your ability to perform destructive analysis later. Your pcb fault finding strategy should always begin here, before any invasive procedure.
Key Techniques for PCBA Failure Analysis
Electrical Testing and Functional Verification
Electrical testing helps you narrow down the problem from the whole board to a specific part or connection. In-circuit testing (ICT) uses a bed-of-nails fixture that touches many test points at the same time. This allows you to check individual parts like resistors, capacitors, and diodes, and run boundary scans. Since you test parts before the board is powered up, you can find assembly faults like wrong values, open circuits, or shorts early. This early finding makes fault isolation easier by pointing to the exact spot that does not match expected electrical values, without turning on the whole board.
Functional testing works differently. You power up the finished PCB and check that it does what it is supposed to do. This test confirms the board works as a complete system and catches issues that come from how parts interact. For example, a timing problem between two chips might pass individual checks but fail during functional testing. You should use both methods: in-circuit testing for part-level faults, and functional testing for system-level behavior. Together, these PCB testing techniques give you a full electrical check.
Advanced Imaging and X-Ray Fluoroscopy
X-ray fluoroscopy shows you real-time internal images without destroying your sample. This advanced PCB analysis method reveals solder joint quality under BGA, CSP, and QFN packages—areas you cannot see with visual inspection. The system's focal spot size is between 1 and 10 µm, so it can detect features as small as a few micrometers. For IPC Class 2 standards, you can find solder voids where a single BGA ball's void area is more than 25% of the ball area, or the total void area across all balls is over 30%. Thermal pad voids in QFN packages become visible when the void area is more than 30% of the pad area. Solder bridging shows up clearly, and you can spot open joints or head-in-pillow defects by looking at the solder shape—spherical or waist-like shapes indicate problems.
X-ray fluoroscopy is great at finding internal shorts, broken traces, and hidden defects under chips. However, microcracks smaller than 1 µm need other methods like scanning acoustic microscopy (C-SAM) or cross-sectioning. C-SAM finds delaminations, voids in underfill, and solder joint cracks by imaging the condition of polymer interfaces that X-rays cannot see. This method is especially useful for detecting air gaps between layers that X-rays might miss.
Your PCB fault finding plan should use these methods in order. Start with visual inspection to record surface conditions. Move to X-ray fluoroscopy for internal joint analysis. Use C-SAM when you think there might be delamination or underfill voids. This step-by-step approach keeps your sample safe while you gather the most evidence. These PCB inspection methods work together to build a complete picture of the failure before you move to destructive analysis.
For a thorough PCB failure analysis, you need to know the limits of each method. X-ray fluoroscopy finds voids, bridges, and open circuits with high accuracy. Acoustic microscopy shows interface conditions that other methods cannot see. Electrical testing confirms how the board works. No single method gives all the answers. Your PCB fault finding process must combine several approaches on purpose.
The key rule: always use non-destructive methods before destructive ones. You cannot re-examine a sample after cross-sectioning.
These advanced PCB analysis methods turn your failure analysis from guesswork into a step-by-step investigation. Each method gives unique information, and together they show the full failure mechanism.
PCB Failure Analysis: From Hypothesis to Confirmation
Formulating and Prioritizing Hypotheses
You now have a full evidence picture from non-destructive inspection. Your next step turns that data into a focused set of possible failure causes. Start by listing every plausible reason that matches what you saw. Thermal stress, contamination, mechanical fatigue, and electrical overstress are the most common groups. A solder void seen on X-ray might point to poor reflow settings. Corrosion found during visual inspection suggests weak cleaning or harsh surroundings. Each piece of evidence narrows your options.
Rank your hypotheses with a simple scoring system. Score each possible cause by its likelihood, its power to explain all observed signs, and its fit with the operating conditions you recorded. A hypothesis that explains every symptom deserves higher priority than one that explains only a few. For example, if your board failed on and off under vibration, mechanical fatigue becomes a stronger candidate than contamination. Write down your reasoning for each ranking. This habit stops confirmation bias and keeps your pcb fault finding process fair. Also think about whether several mechanisms might act together, such as thermal cycling weakening a joint that later fails under mechanical stress.
Destructive Analysis for Verification
Non-destructive methods narrow your choices, but they cannot confirm the exact failure cause. Destructive analysis provides that proof. Cross-sectional analysis, also called microsectioning, cuts through the suspect area and polishes it for microscope study. This method reveals the inner structure of solder joints, showing void spread, intermetallic compound thickness, and crack paths. You can measure the crack length and see whether it started at the component side or the board side. This information directly confirms or rules out your top hypotheses.
Scanning Electron Microscopy (SEM) pushes your analysis further. SEM offers magnifications up to 100,000x, showing fracture surface details invisible under optical microscopes. Ductile fractures show dimpled surfaces, while brittle fractures display cleavage planes. Contamination appears as distinct elemental signatures when you use Energy Dispersive X-ray Spectroscopy (EDS), an SEM attachment. These advanced pcb analysis techniques give solid proof about the failure cause. Remember that these methods permanently change your sample. You cannot re-examine the original board after cross-sectioning. So, you must finish all non-destructive pcb testing techniques first and record everything fully. Your pcb failure analysis journey ends with a confirmed cause, not a guess. This proof then feeds directly into your root cause identification, where you trace the cause back to its source in design, manufacturing, or environmental factors.
Identifying the True Root Cause
You have confirmed the failure mechanism through destructive analysis. Now you must trace that mechanism back to its origin. This step separates a permanent fix from a temporary patch. Your confirmed cause belongs to one of three categories: manufacturing, design, or environmental. Each category demands a different corrective strategy.
Distinguishing Manufacturing, Design, and Environmental Factors
Manufacturing defects stem from process errors during fabrication or assembly. Plating voids appear as gaps in copper deposition, caused by uneven coating, air bubbles, or poor cleaning. Assembly errors include loose parts and connection problems from improper handling. De-panelization micro-cracks can trigger conductive anodic filament (CAF) failure. Insufficient solder paste volume combined with an incorrect reflow profile produces weak joints. Electrostatic discharge during handling damages sensitive components silently. These defects share one trait: they occur despite a sound design.
Design flaws exist before manufacturing begins. Incorrect trace width—less than 6 mils for high-current paths—causes overheating and eventual open circuits. Trace spacing of 4 mils instead of 8 mils invites arcing between adjacent conductors. Impedance mismatch, such as 55 ohms instead of 50 ohms, degrades signal integrity in high-speed circuits. Poor component placement creates electromagnetic interference. Insufficient insulation material leads to dielectric failure. Limited test access prevents proper inspection. These flaws require design revision, not process adjustment.
Environmental stresses attack even well-designed, properly manufactured boards. Thermal cycling from -40°C to +125°C weakens solder joints through repeated expansion and contraction. Humidity at 85% relative humidity creates leakage paths and corrosion on conductive surfaces. Vibration per MIL-STD-202 simulates transport and installation stress, causing connector wear and joint fracture. Moisture, dust, power surges, and aggressive chemicals accelerate degradation. These factors demand environmental protection, not redesign.
Category | Specific Evidence |
|---|---|
Manufacturing Defects | Plating voids, assembly errors, de-panelization micro-cracks, insufficient solder paste, ESD damage |
Design Flaws | Incorrect trace width, impedance mismatch, poor component placement, insufficient spacing |
Environmental Stresses | Thermal cycling, humidity exposure, vibration, corrosive environments |
Your pcba failure analysis must classify the confirmed mechanism correctly. Misclassification leads to wasted corrective effort. A design flaw treated as a manufacturing issue will recur on every new batch.
Using Fault Tree Analysis for Traceability
Fault Tree Analysis (FTA) provides a logical method to trace your confirmed failure mechanism back to its origin. This top-down approach starts with the failure event and works backward through possible causes. Each branch represents a potential contributor. You evaluate each branch against your evidence and eliminate those that do not match.
Construct your fault tree with the confirmed failure at the top. Below it, draw branches for manufacturing, design, and environmental factors. Under each branch, list specific sub-causes. For example, under manufacturing, list solder voids, misalignment, and contamination. Under design, list inadequate trace width, thermal issues, and impedance mismatch. Under environmental, list humidity, vibration, and temperature extremes.
Work through each branch systematically. Your cross-section analysis showed a crack path starting at the component side. This evidence eliminates board-side stress concentration. Your X-ray revealed no solder voids, ruling out reflow issues. Your electrical testing showed correct component values, excluding assembly errors. Each elimination narrows your search. The remaining branch—thermal fatigue from environmental cycling—becomes your root cause.
FTA works because it forces you to consider every possibility without bias. You cannot skip branches because they seem unlikely. You must justify each elimination with evidence. This discipline prevents the common mistake of stopping at the first plausible cause. Your pcb fault finding process becomes thorough and defensible.
The output of your FTA feeds directly into corrective action planning. A confirmed manufacturing root cause requires process control improvements. A design root cause requires layout revision. An environmental root cause requires protective measures. Your root cause analysis concludes only when you can explain every observed symptom through one coherent chain of events. This complete picture ensures your corrective action addresses the true source, not a convenient symptom.
Design PCBs with thermal cycling in mind, use conformal coatings to protect against moisture and thermal shock. For high-vibration applications, reinforce connectors with epoxy or lock washers. MIL-STD-883 tests mechanical shock resistance, ensuring the board can withstand environmental mechanical stress.
Your advanced pcb analysis techniques—cross-sectioning, SEM, and X-ray—provide the evidence that makes FTA effective. Without this evidence, your fault tree becomes speculation. With it, you trace each branch with confidence. This combination of rigorous testing and logical analysis transforms your pcb failure analysis from guesswork into engineering certainty.
Implementing Corrective and Preventive Actions
Now that you have confirmed the root cause, you need to take action. Do not just apply a quick fix. Fixing a solder joint or replacing a bad component only treats the symptom. A real corrective action removes the cause of the problem so the same failure never happens again. For example, repeatedly adjusting a tool that drifts off does not fix the real issue. You need to understand why the drift happens and stop it from happening again.
Developing Effective Corrective Action Plans
A strong corrective action plan follows a step-by-step order. First, stop the problem from spreading. Hold back affected batches, check assemblies, and keep evidence safe to protect your customers while you look into it. Second, do a careful root cause analysis using methods like 5 Whys or fishbone diagrams to find out why the defect happened and why your current checks did not catch it. Third, make permanent changes that fix the confirmed root cause. This step might mean changing process limits, updating tooling, rewriting work instructions, or making the design easier to manufacture.
Your plan must also include a check. You need written proof that the corrective action removed the failure cause and did not create new problems. Inspect the next production run and compare defect numbers with past results. Finally, write down everything: cause, action, person in charge, date, and proof. This record keeps the knowledge for later use.
Component | Description |
|---|---|
Containment | Temporary measures to protect customers during investigation |
Root Cause Analysis | Systematic investigation using 5 Whys or fishbone diagrams |
Corrective Action | Permanent changes addressing the verified root cause |
Verification | Confirmation the action worked with documented evidence |
Establishing Preventive Measures and Monitoring
Preventive measures keep the same failure from happening again across your whole production line. Begin with Design for Manufacturing (DFM) reviews. Check that filenames, revisions, drawing notes, BOM data, and released outputs all match. Verify that the netlist connects to the intended copper data. Look at manufacturability factors such as conductor spacing, annular rings, aspect ratios, and mask clearances. Fix any issues before tooling starts.
Process controls are your second line of defense. Ask your manufacturer for DFM records that show how conflicts and exceptions were recorded. Ask for proof of controls that cover key inputs, outputs, monitoring methods, and reaction limits. Set up traceability so that materials, batches, and revisions stay linked during production. Use change management steps that need a review before any process change.
Ongoing monitoring finishes your preventive plan. Use automated optical inspection in production to find soldering defects early. Improve reflow profiles with real-time process monitoring. Apply Design for Testing rules during PCB layout to make testing easier. Make design reviews stronger by focusing on assembly guidance to avoid silkscreen mistakes. Set up clear version control to get rid of documentation errors.
The design or contract authority picks the quality level, and the manufacturer must support it with the right design rules, materials, controls, inspection, and testing.
Your pcb failure analysis journey ends with these actions. The failure analysis you did guides every fix decision. Your pcb now has a permanent fix, not a quick patch. Manufacturing defects go down as process controls get tighter. Functional testing confirms the board works correctly. Functional verification proves the fix works under real conditions. Testing at every stage checks your changes. This step-by-step method turns a single failure into a long-term improvement across your whole product line.
Your pcb failure analysis journey moves from symptom to solution. The goal extends beyond one board. You eliminate the source across the entire product lifecycle. A combination of non-destructive and destructive techniques builds a complete picture. This analysis approach reveals hidden defects and confirms true root causes. Functional testing and other testing methods verify your fix. Manufacturing improvements stop those defects from recurring. Your pcb also benefits from better functional performance. Position your failure analysis as a strategic investment. It reduces long-term costs and improves pcb reliability. Customers trust boards that survive. Adopt this systematic approach as standard practice in your engineering workflow.
FAQ
What is the first step in a PCBA failure analysis?
Your pcb failure analysis starts by writing down the failure mode and operating conditions before testing. Use non-destructive methods like visual inspection, AOI, X-ray, and in-circuit testing. These methods keep the pcb safe for more analysis later.
How do non-destructive and destructive analysis differ?
Non-destructive methods like X-ray and AOI keep your pcb intact. Destructive methods like cross-sectioning and SEM change the sample for good. Always use non-destructive methods first to collect evidence without causing damage.
How do you distinguish manufacturing defects from design flaws?
Manufacturing defects come from process errors even when the design is good. Design flaws exist before manufacturing starts. The blog lists examples: plating voids and assembly errors versus incorrect trace width and impedance mismatch.
What is the goal of corrective actions?
Remove the root cause, not just the symptom. Fixing a solder joint only treats the symptom. The same defects will come back if you do not fix the source. A real corrective action changes process limits, updates tooling, or revises the design.
See Also
Essential Strategies For Enhancing PCBA Durability Over Time
Understanding PCBA And Its Core Components Explained
Decoding The Meaning Of PCBA In Electronic Devices